
3B PROJECT SCHEDULE
Lesson 3
3b Project Schedule
You are on page 2 of 5 pages
Next task in project planning phase is to create the project schedule, in three steps.
(1) The logical sequence of work packages: Network Diagram
The network diagram represents the logical sequence of all work packages. We answer the question: in what sequence do we have to do all the work?
For our desk, we only consider the work packages and arrange them
into a logical sequence. For example, before drilling the holes into the
desk top, we need to cut it. Before cutting it, we need to buy it. And
so on ...
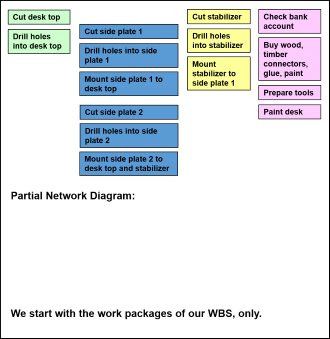
In that example, we could end up with a network diagram like the following.
(Here is a larger version to download.)
(2) Introducing a time reference: The Gantt Chart
The Gantt chart represents the sequence of all
work packages with reference to a time line. Each work package is
symbolized by a bar with a length that corresponds to its duration.
We usually set up the network diagram with some project planning
software package, like MS Project. So, we can switch back and forth
between the network diagram and the Gantt chart by simple mouse-click.
Since the project planning software sets the duration of each work
package to a default value, we need to adjust all the work package
durations to values based on our estimation. For our desk, we could get a
Gantt chart like this:
In case we set up the Gantt chart manually, we make sure that we keep
the same logical sequence of work packages as in the network diagram.
(3) Gantt Chart with Milestones
For larger projects, we need to have an overview of the schedule
for the project as a whole. We achieve this by introducing milestones that indicate significant points in our project schedule.
In our example, we could come up with the following Gantt chart with milestones:
On project level, we present the milestone plan that shows only milestones with reference to a time line.
On the next page, we will introduce the calculation of dates and total float of a project.
Return from 3b Project Schedule to Home Page
|
|
|
Your Comments
Have your say about what you just read! Leave me a comment in the box below.