
4B CONTROLLING TOOLS
Lesson 4
4b Controlling Tools
You are on page 2 of 3 pages
On this page, 4b Controlling Tools, we cover basic controlling tools for controlling the scope, schedule and cost.
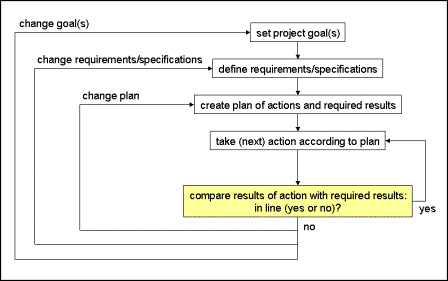
Referring to the basic control cycle let us introduce
how we use our planning documents to support the comparison of actual
with required results from a project management point of view.
(1) Work Breakdown Structure
The WBS gives us a complete overview of all the work of the
project in form of a structured list or graphical representation of work
packages. Each work page describes details of that particular part of
the work and required results. Consequently, we can use the WBS in order to compare actual with required results - work package by work package.
(one strike: work package started but not yet complete; two strikes: work package complete)
(2) Network Diagram
Similarly, we can use the network diagram to compare actual with required results - again work package by work package.
(one strike: work package started but not yet complete; two strikes: work package complete)
(3) Gantt Chart
In order to support our schedule controlling we use the Gantt chart:
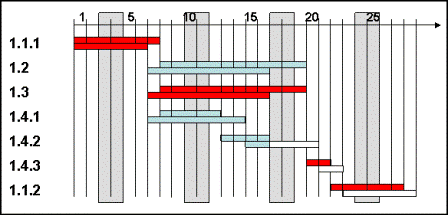
We read this graphical representation like that:
Project status this month, on day 16;
work package 1.1.1: started on time, complete 1 day early;
work package 1.2: started 1 day early, finished 1 day early;
work package 1.3: started 1 day early, finished 1 day early;
work package 1.4.1: started 1 day early, finished 2 days late;
work package 1.4.2: started 2 days late, still in process;
work package 1.4.3: not yet started;
work package 1.1.2: not yet started.
(4) Cost Plan
In order to support cost controlling we use the plan of accumulated cost:
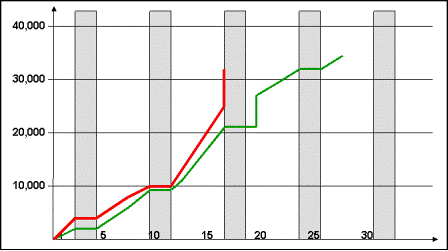
We read this like that:
On day 16 we should have accumulated cost of 21,000.-- but have actual accumulated cost of 32,000.--
Usually, we summarize the findings of every comparison in a project status report. In our example, on day 16, such a status report could look like this:
- work results of work packages 1.1.1, 1.2, 1.3, and 1.4.1 achieved, work on 1.4.2 in process
- possible delay of the project: 2 days
- possible total cost of the project: 34,400.-- * 32 / 21 = 52,419.-- (accumulated cost as of day 16, projected to the total cost)
Return from 4b Controlling Tools to Home Page
|
|
|
Your Comments
Have your say about what you just read! Leave me a comment in the box below.