
- Home
- Free Downloads
- Demos
Demos, for your practice
This is our page for small demos. Some wise man said: one picture explains more than 1000 words. We think this is true, and translate it into: one movie or animation explains more than 1000 pictures (that would be a short movie of 40 seconds, at 25 frames per second).
(1) MTA (Milestone Trend Analysis)
The first one is an inter-active combination of MTA table and MTA diagram that illustrates how we apply this tool. You can practice to work with it by entering your own project milestones and the relevant dates.
Click on the following image or link to open the MTA demo in a new tab or window of your browser.
")
MTA for practice
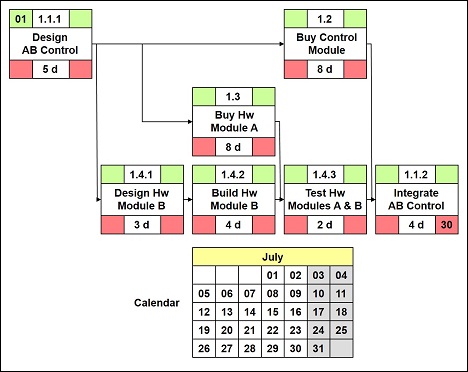
(2) Forward / Backward Pass
Here, you can follow a few steps into the forward / backward pass and then do your own calculation based on a small network diagram.
 Comment:
Your wishes for more demos
We are expanding this sub-section. So, should you have questions, comments, recommendations, or feedback, please let us know and mailto:contact@project-management-knowhow.com
Return to Free Downloads
Return from Demos to Home
|
|
|
Your Comments
Have your say about what you just read! Leave me a comment in the box below.