- Home
- Implementation
- Earned Value Project Management
Earned Value Project Management
Published: 2009-04-01
Last updated: 2022-03-19
Earned Value Project Management uses Earned Value Analysis (EVA), which is another important project controlling tool that helps to control cost and schedule in larger projects or sub-projects. The following example shows how it works.
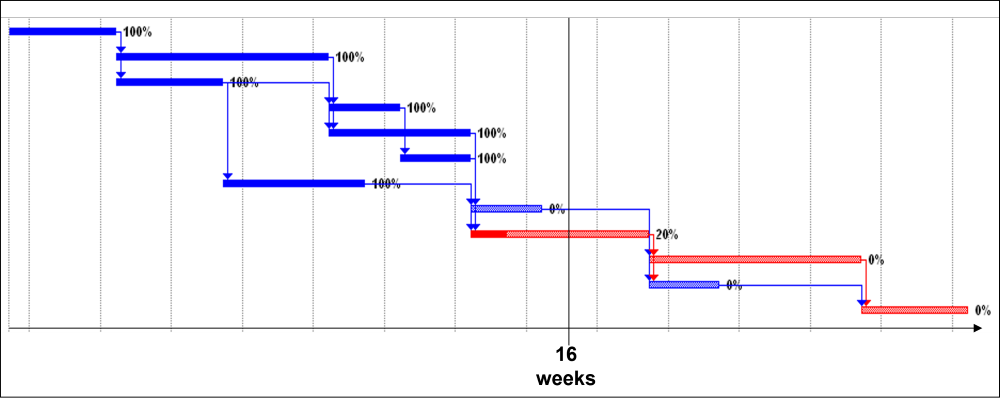
Let us assume we are at the end of week 16 of a small project with 12 work packages, 7 of which are already completed, and another work package has been started.
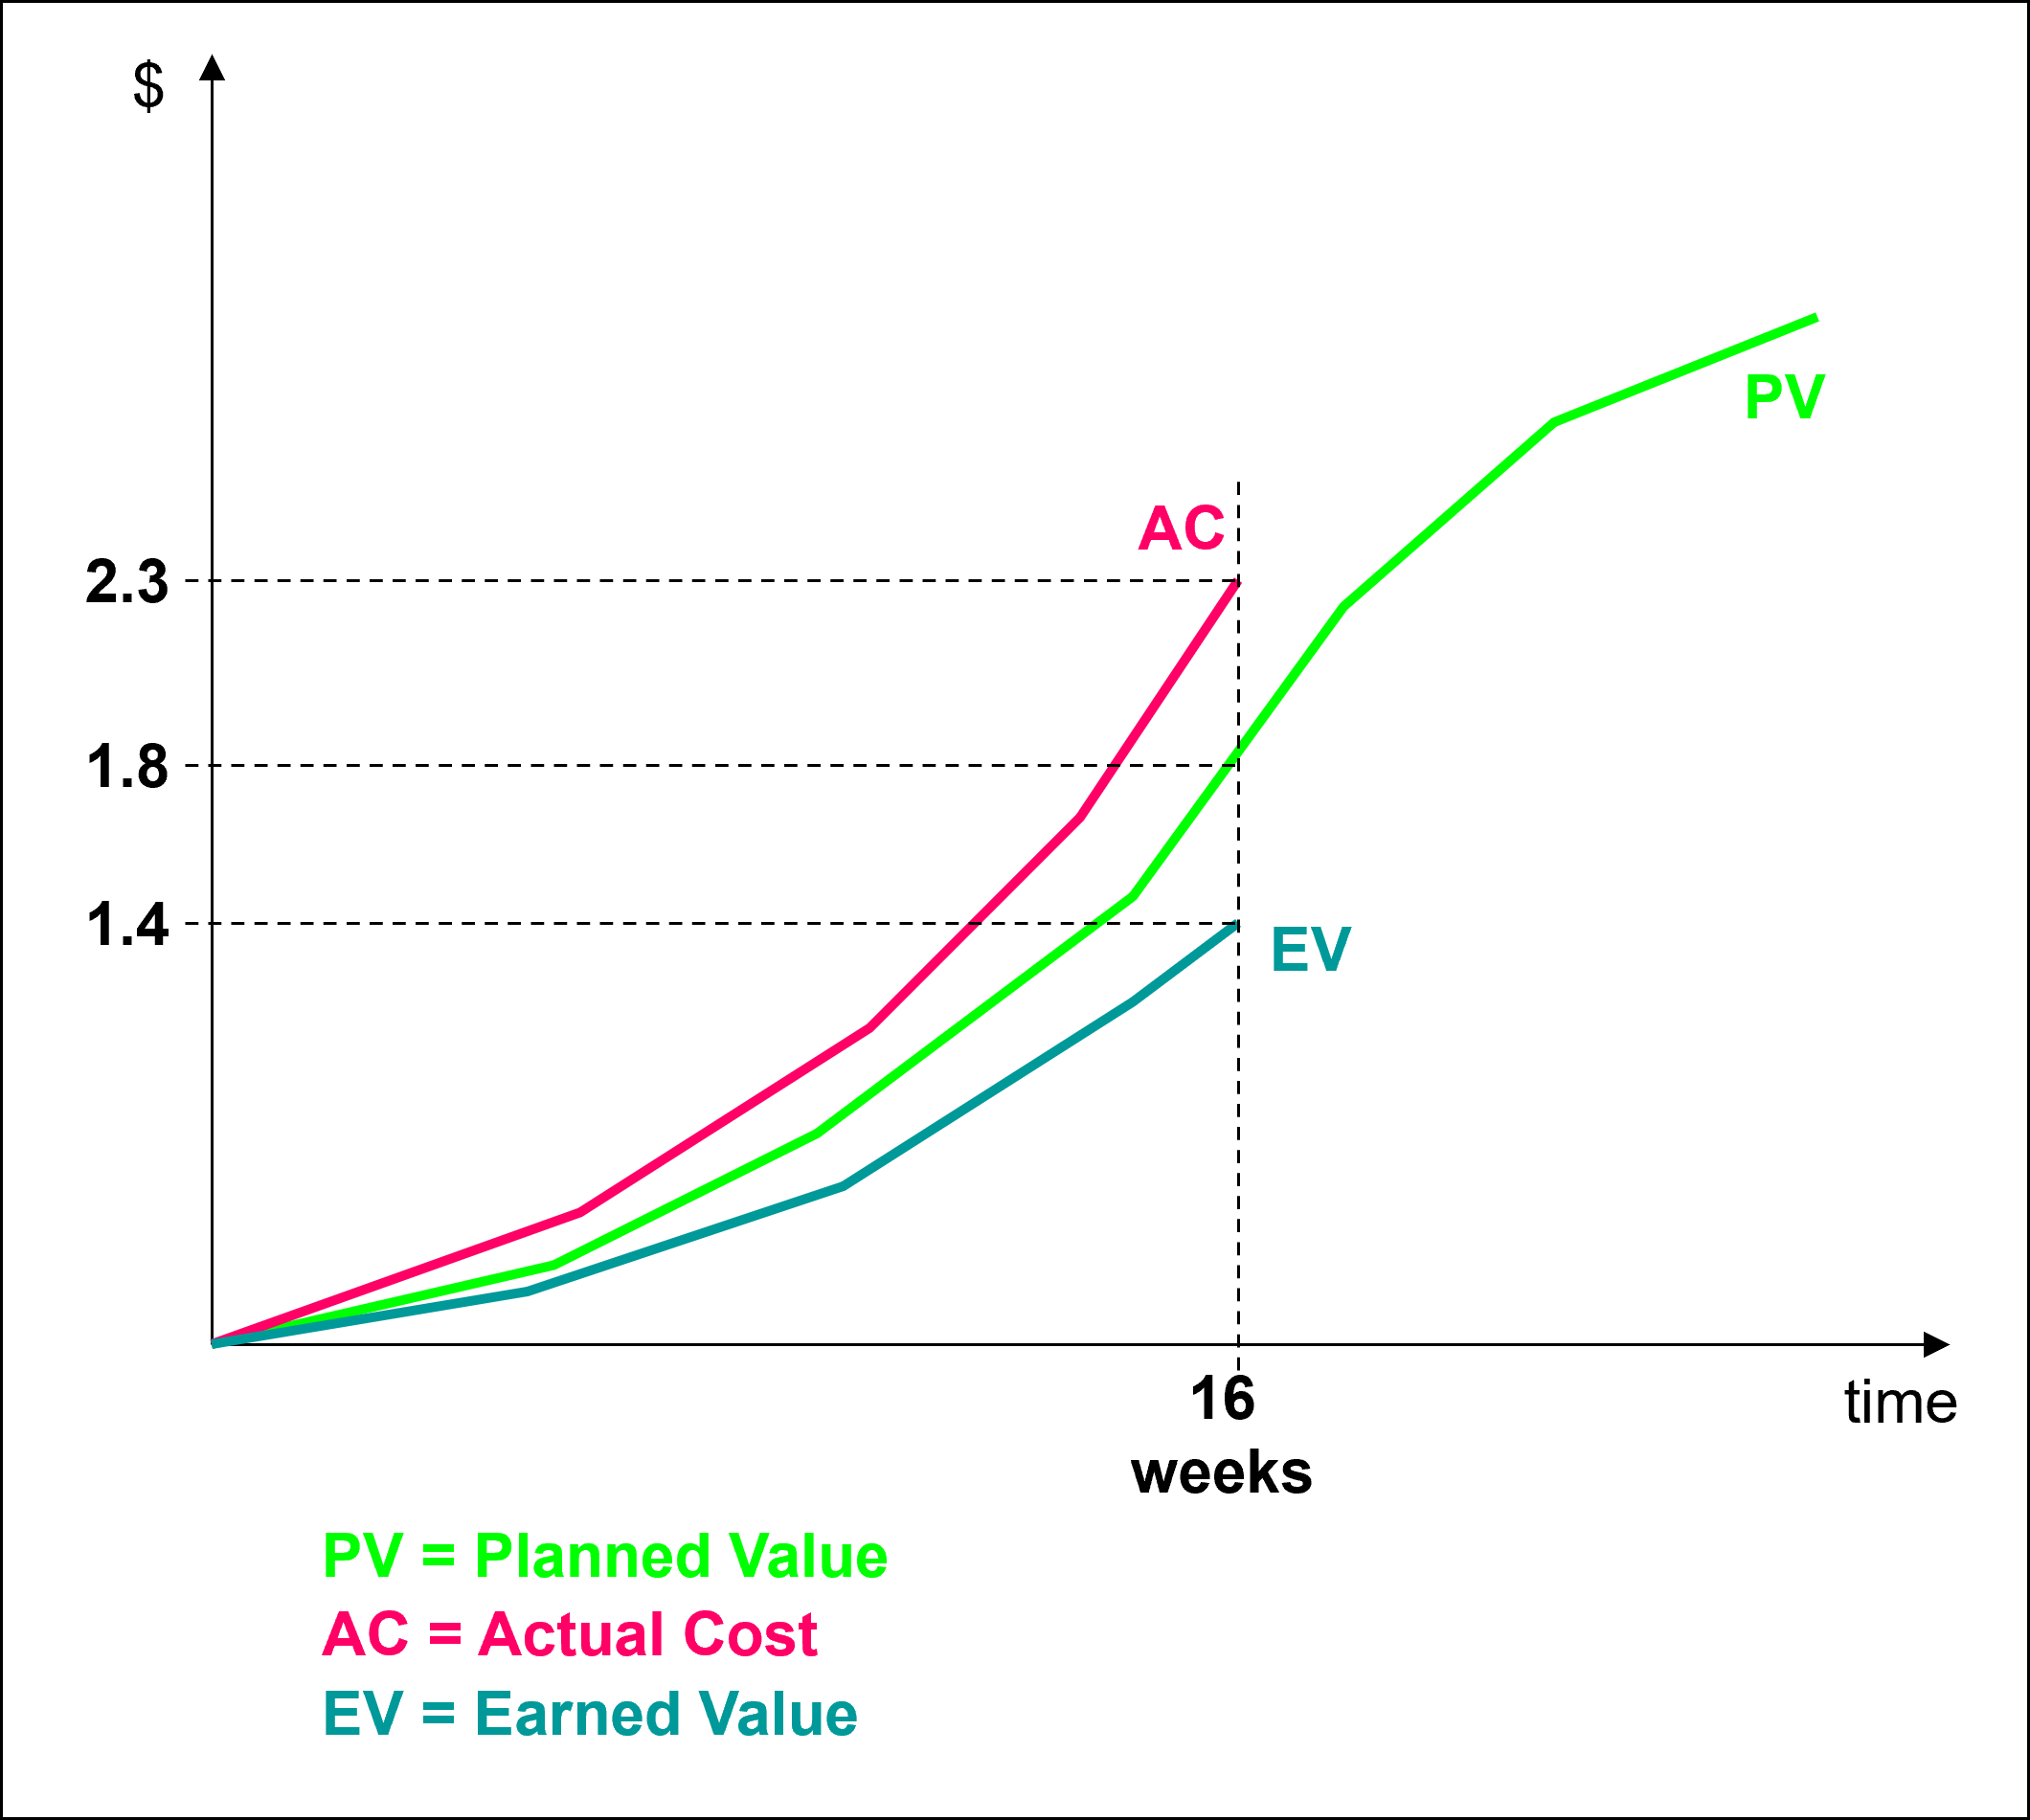
Our project account shows the actual cost accrued, AC = 2.3 Mill. $, and the work package experts tell us the value of the work accomplished, earned value, EV = 1.4 Mill. $. The project planning documents show that by the end of week 16 we should have accomplished work corresponding to the planned value, PV = 1.8 Mill. $.
In earlier presentations of that matter we find
- Planned Value PV = Budgeted Cost of Work Scheduled BCWS
- Earned Value EV = Budgeted Cost of Work Performed BCWP
- Actual Cost AC = Actual Cost of Work Performed ACWP
Performance Indices: CPI & SPI
We use the values PV, EV and AC to calculate Cost Performance Index (CPI) and Schedule Performance Index (SPI):
In our example, we obtain CPI = 0.609 and SPI = 0.778 indicating that we are over budget and behind schedule, because CPI < 1 and SPI < 1.
- If CPI < 1, the project is over budget
- If CPI = 1, the project is on budget
- If CPI > 1, the project is under budget
- If SPI < 1, the project is behind schedule
- If SPI = 1, the project is on schedule
- If SPI > 1, the project is ahead of schedule
Earlier presentations refer to
- Cost Variance CV = BCWP – ACWP = EV - AC
- Schedule Variance SV = BCWP – BCWS = EV – PV
In our example, this would lead to a
- Cost Variance of CV = 1.4 Mill. $ - 2.3 Mill. $ = - 0.9 Mill. $
- Schedule Variance of SV = 1.4 Mill. $ - 1.8 Mill. $ = - 0.4 Mill. $
Remark
Using earned value analysis might not be sufficient if we need to solve problems of cost or schedule overrun. Under most conditions, we can combine it with other tools like
- Milestone Trend Analysis, and
- the "simple" tools: WBS, network diagram, Gantt chart (as we describe in more detail in our sub-section Project Controlling Tools).
35+ templates, tools, and checklists in one set
To save you time in your daily work as a project manager, I packaged more than 35 project management templates, tools, and checklists into one zip file.
- You un-zip it, and you get all items in formats you can edit to your requirements.
- They strictly contain only standard functionality and no macros or other code.
- You are allowed to use your logo.
or click here for more info.
Traditional PM
Learning Path Navigation
|
|
|
Return to Implementation Phase
Return to Project Management Dashboard
Return from Earned Value Project Management to Home Page
|
|
|


Your Comments
Have your say about what you just read! Leave me a comment in the box below.